
Updated SEPTEMBER 2026
106 Truck Accident Statistics September 2026
By Elliot Singer, Esq. · Reviewed September 13, 2026
Updated SEPTEMBER 2026
The person who dies in a large-truck crash is usually not the person in the truck. That is not a slogan. It is how the federal census is built: a large truck is any medium or heavy truck, excluding buses and motor homes, with a GVWR over 10,000 pounds, commercial or not (NHTSA NCSA, June 2026).
This page is a crash-and-injury census, not a case-value page. FARS counts deaths. CRSS estimates injuries. FMCSA's MCMIS file uses a different crash threshold. BLS counts work deaths, not traffic deaths. Mixing those books invents a fourth definition. Every figure below is dated, linked to the origin, and labeled when it is an estimate. No settlements. No verdicts. No case-value averages.
Colorado statewide crash ledgers live on the parent firm at conduit.law Colorado car accident statistics. This hub is national large-truck involvement.
Key Takeaways
- 5,340 people were killed in traffic crashes involving large trucks in 2024, down 2.5% from 5,478 in 2023 (NHTSA NCSA, June 2026).
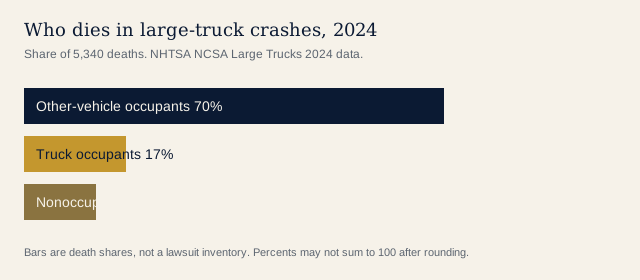
- 70% of those deaths were occupants of other vehicles (NHTSA NCSA, June 2026).
- An estimated 161,201 people were injured in large-truck crashes in 2024 (NHTSA NCSA, June 2026).
- An estimated 548,521 large trucks were in police-reported crashes in 2024 (NHTSA NCSA, June 2026).
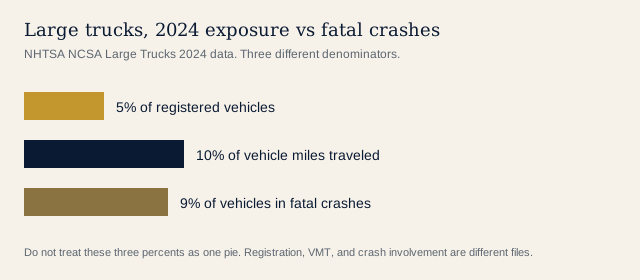
- Large trucks were 5% of registered vehicles and 10% of VMT in 2024, but 9% of vehicles in fatal crashes (NHTSA NCSA, June 2026).
- 80% of large trucks in fatal crashes were in multivehicle crashes, versus 63% of passenger vehicles (NHTSA NCSA, June 2026).
- 4% of large-truck drivers in fatal crashes had a BAC of .08 g/dL or higher, versus 25% of motorcycle and passenger-car drivers (NHTSA NCSA, June 2026).
- IIHS's FARS cut puts 62% of 2024 large-truck-crash deaths in passenger vehicles, 17% in the truck, and 19% among pedestrians, bicyclists, and motorcyclists (IIHS, June 2026).
- 798 heavy and tractor-trailer truck drivers died at work in 2024 (BLS, February 2026).
- FHWA counted 16,082,510 single-unit plus combination trucks registered in 2024 (FHWA, February 2026).
- In FMCSA's 2022 LTBCF year, 82% of fatalities in fatal large-truck crashes were not occupants of the large truck (FMCSA, October 2025).
- 76% of fatal large-truck crashes in 2024 happened on weekdays (NHTSA NCSA, June 2026).
How many people die in large-truck crashes?
Deaths "in crashes involving large trucks" are not the same as truck-occupant deaths. The first number includes the car next to the truck. The second is the cab. Keep them apart.
What is the latest nationwide death count?
NHTSA's large-truck fact sheet is the current census for this page. The 2024 count is labeled from FARS ARF.
- 5,218 large trucks were in fatal traffic crashes in 2024 (NHTSA NCSA, June 2026).
- 69% of those trucks were heavy trucks with GVWR over 26,000 lb (3,578), and 31% were medium trucks (1,618) (NHTSA NCSA, June 2026).
- U.S. motor vehicle traffic deaths overall were 39,254 in 2024 (NHTSA Overview, April 2026).
- IIHS's FARS analysis: 14% of all motor vehicle crash deaths in 2024 occurred in large-truck crashes (IIHS, June 2026).
- That 2024 death total was 58% higher than the 2009 low in IIHS's series (IIHS, June 2026).
How has the 10-year death line moved?
NHTSA Table 2 is the killed series. Do not splice a 2015 GES injury estimate onto a 2024 CRSS injury estimate and call it one trend.
- 4,095 people were killed in large-truck crashes in 2015 (NHTSA NCSA, June 2026).
- The series peaked at 5,969 in 2022, then 5,478 in 2023 (NHTSA NCSA, June 2026).
- FMCSA's LTBCF, which still publishes a 2022 annual, counted 6,050 large trucks and buses in fatal crashes that year, up 2% from 2021 (FMCSA, October 2025).
- Large truck and bus fatalities per 100 million VMT by all motor vehicles were 0.192 in 2022, 6% below the 21st-century peak of 0.205 in 2000 (FMCSA, October 2025).
- From 2005 to 2009, fatal crashes involving large trucks or buses fell 34%, then rose 25% between 2016 and 2022 (FMCSA, October 2025).
Who is killed: the truck, the other vehicle, or people outside?
This is the argument of the page. Most of the harm lands next to the truck, not in it.
How does NHTSA split 2024 deaths by person type?
- 920 large-truck occupants were killed in 2024: 560 in single-vehicle crashes and 360 in multivehicle crashes (NHTSA Overview, April 2026).
- 3,753 occupants of other vehicles were killed, and 667 nonoccupants were killed (NHTSA Overview, April 2026).
- Truck-occupant deaths were 17% of the 2024 large-truck-crash total in NHTSA Table 2; other-vehicle occupants were 70%; nonoccupants were 12% (NHTSA NCSA, June 2026).
- IIHS groups motorcyclists with pedestrians and bicyclists, so its outside-the-truck share reads 19%, not NHTSA's 12% nonoccupant line (IIHS, June 2026).
- Truck-occupant deaths in IIHS's series were 84% higher in 2024 than in 2009 (IIHS, June 2026).
If you were in a passenger vehicle in a truck crash, that is the census that describes you. A free claim review is the next step when the crash is yours, not another chart.
How do injuries split?
Injury counts are CRSS estimates. They move in the hundreds of thousands. They are not a death census.
- Of people injured in 2024, 72% (116,475) were occupants of other vehicles (NHTSA NCSA, June 2026).
- 26% (41,454) were large-truck occupants (NHTSA NCSA, June 2026).
- 2% (3,273) were nonoccupants, a 20% drop from 2023 (NHTSA NCSA, June 2026).
- Occupants of other vehicles injured rose 8.2% (NHTSA NCSA, June 2026).
- Truck occupants injured in single-vehicle crashes rose 12% to 14,652; those injured in multivehicle crashes fell 6.3% to 26,802 (NHTSA Overview, April 2026).
- U.S. traffic injuries overall were an estimated 2.42 million in 2024 (NHTSA Overview, April 2026).
How exposed are large trucks relative to the fleet?
A 5% fleet share and a 9% fatal-crash share are not a mystery if the miles are different. Cite the registration file and the crash file separately.
What does FHWA count for trucks on the road?
- Combination-truck registrations were 3,482,896 in 2024; single-unit trucks were 12,599,614 (FHWA, February 2026).
- All motor vehicles registered: 297,525,836 in 2024, up from 284,614,269 in 2023 (FHWA, February 2026).
- Combination trucks averaged 55,276 miles per vehicle in 2024 (FHWA, February 2026).
- Single-unit plus combination trucks together averaged 20,494 miles and 7.5 miles per gallon (FHWA, February 2026).
- Truck VMT in the NHTSA involvement table was 329,600 million miles in 2024, with a fatal involvement rate of 1.58 per 100 million large-truck VMT (NHTSA NCSA, June 2026).
- That fatal involvement rate was 32.45 per 100,000 registered large trucks in 2024, down from 36.14 in 2023 (NHTSA NCSA, June 2026).
- Passenger vehicles were 91% of registered vehicles in the 2024 fact sheet comparison line (NHTSA NCSA, June 2026).
- Injury-crash involvement was 751 per 100,000 registered large trucks in 2024 (NHTSA NCSA, June 2026).
- Large trucks were 5% of vehicles in injury and property-damage-only crashes (NHTSA NCSA, June 2026).
What do fatal large-truck crashes look like?
Where and when?
- 25% of fatal large-truck crashes in 2024 were on interstates (NHTSA FARS, June 2026).
- 56% were in rural areas (NHTSA FARS, June 2026).
- 5% were in work zones (NHTSA FARS, June 2026).
- Of weekday fatal large-truck crashes, 70% were in daytime hours 6 a.m. to 5:59 p.m. (NHTSA FARS, June 2026).
- IIHS: 51% of 2024 deaths in large-truck crashes were on major roads that are not interstates or freeways; 30% were on interstates and freeways; 18% were on minor roads (IIHS, June 2026).
- 47% of large-truck-crash deaths fell between 6 a.m. and 3 p.m., versus 28% of deaths in crashes that did not involve a large truck (IIHS, June 2026).
- 58% of 2024 large-truck-crash deaths involved a tractor-trailer; 37% involved a single-unit truck (some crashes involved both) (IIHS, June 2026).
- 60% of large-truck occupants killed in multiple-vehicle crashes died in collisions that involved another large truck (IIHS, June 2026).
How do two-vehicle fatal crashes start?
- In two-vehicle fatal crashes (excluding two large trucks), the first impact was on the front of the large truck in 59.9% of cases, including 30.7% front-to-front (NHTSA FARS, June 2026).
- The rear of the large truck was the first impact point in 22.1%, including 21.2% where the other vehicle's front hit the truck's rear (NHTSA FARS, June 2026).
- Both vehicles were going straight in 42.4% of those two-vehicle fatal crashes (NHTSA FARS, June 2026).
- The other vehicle was turning left in 8.9%; both were negotiating a curve in 8.6%; the large truck was stopped in the road in 6.3% (NHTSA FARS, June 2026).
What does FMCSA's 2022 LTBCF still add?
The newest full Large Truck and Bus Crash Facts HTML edition on FMCSA's index is 2022, last updated October 10, 2025. It is a different year than NHTSA's 2024 fact sheet. Do not average them.
Crash counts and thresholds
- About 503,000 police-reported large-truck crashes in 2022: 5,279 fatal (1%) and 114,000 injury (23%) (FMCSA, October 2025).
- Single-vehicle crashes were 21% of fatal, 16% of injury, and 22% of PDO large-truck crashes; 62% of fatal large-truck crashes involved two vehicles (FMCSA, October 2025).
- 54% of fatal large-truck crashes were rural, 27% were on Interstates, and 13% were on rural Interstates (FMCSA, October 2025).
- 39% of fatal large-truck crashes were at night (6 p.m. to 6 a.m.) (FMCSA, October 2025).
- 82% of fatal and 88% of nonfatal large-truck crashes were on weekdays (FMCSA, October 2025).
- Collision with a vehicle in transport was the first harmful event in 73% of fatal, 81% of injury, and 77% of PDO large-truck crashes (FMCSA, October 2025).
- Overturn was the first harmful event in 4% of fatal and 2% of nonfatal large-truck crashes (FMCSA, October 2025).
- 29% of work-zone fatal crashes and 12% of work-zone injury crashes involved at least one large truck (FMCSA, October 2025).
- There were 15.8 fatal large-truck crashes per million U.S. people in 2022, up 50% from 10.6 in 2010 (FMCSA, October 2025).
- Fatal large-truck crashes averaged 1.12 deaths; 90% had one fatality (FMCSA, October 2025).
Vehicles, cargo, and people in the 2022 file
- 5,837 large trucks were in fatal crashes in 2022; MCMIS counted 58,992 in injury crashes and 117,641 in towaway crashes (FMCSA, October 2025).
- Hazardous-materials cargo was on 3% of large trucks in fatal crashes; HM was released from 30% of placarded trucks in those crashes (FMCSA, October 2025).
- Flammable liquids were 64% of HM cargo-compartment releases in fatal crashes (FMCSA, October 2025).
- Truck tractors pulling a single semi-trailer were 54% of large trucks in fatal crashes; doubles 2%; triples 0.1% (FMCSA, October 2025).
- Of 5,760 large-truck drivers in fatal crashes, 420 (7%) were 25 or younger and 406 (7%) were 66 or older (FMCSA, October 2025).
- 15% (1,069) of large-truck occupants in fatal crashes were unbelted; 482 of those unbelted occupants (45%) were killed, versus 8% of belted occupants (423 of 5,417) (FMCSA, October 2025).
- 11% of large-truck drivers in fatal crashes (635) were unbelted (FMCSA, October 2025).
- 347 large-truck drivers in fatal crashes (6%) tested positive for at least one drug; 58% of large-truck drivers in fatal crashes were not tested (FMCSA, October 2025).
- At least one driver-related factor was coded for 33% of large-truck drivers in fatal crashes versus 54% of passenger-vehicle drivers (FMCSA, October 2025).
- Large-truck occupant fatalities were 1,097 in 2022, up 9% from 2021; 83% were drivers (FMCSA, October 2025).
- Injury crashes involving large trucks or buses rose 11% from 2016 to 2022 (112,000 to 124,000) in CRSS (FMCSA, October 2025).
- From 2020 to 2022, large trucks in fatal crashes weighing 10,001 to 14,000 pounds rose 26% (722 to 909), and medium-duty trucks in fatal crashes rose 30% (1,302 to 1,694) (FMCSA, October 2025).
FMCSA's 2024 pocket guide is a compact annual of census, inspection, and crash tables. Use the PDF when a 2024 LTBCF chapter is not on the HTML index yet (FMCSA Pocket Guide, September 2025).
Do truck drivers drink less in fatal crashes?
Alcohol-impaired here means BAC .08 g/dL or higher. Commercial operation at .04 is a separate federal rule. Do not treat those thresholds as one number.
- Light-truck drivers in fatal crashes were alcohol-impaired in 19% of 2024 cases (NHTSA FARS, June 2026).
- Large-truck drivers in fatal crashes had a prior recorded crash in 19.3% of 2024 cases, behind motorcycles at 19.5% (NHTSA FARS, June 2026).
- Prior DWI convictions: 1.1% of large-truck drivers versus 3.8% of motorcyclists (NHTSA FARS, June 2026).
- Prior speeding convictions: 17.0% of large-truck drivers versus 22.0% of motorcyclists and 17.6% of passenger-car drivers (NHTSA FARS, June 2026).
- Prior license suspensions or revocations: 7.2% of large-truck drivers versus 15.4% of motorcyclists, 11.8% of passenger-car drivers, and 9.1% of light-truck drivers (NHTSA FARS, June 2026).
- IIHS: 10% of fatally injured large-truck drivers had BACs at or above 0.08% in 2024, versus 31% of fatally injured passenger-vehicle drivers (IIHS, June 2026).
A lower drink-drive share among truck drivers does not make the crash less deadly for the other vehicle. The mass is still there.
Which states show up in the 2024 fatal-truck file?
NHTSA Table 6 is vehicles in fatal crashes. Table 7 is people killed. They are not interchangeable. ICK is licensed in Colorado, Arizona, California, and Kansas. Those four rows are here because they are the practice states, not because they lead the table.
How involved are trucks in fatal crashes, as a share of vehicles?
- Nationwide, 9.3% of vehicles in fatal crashes were large trucks (5,218 of 56,011) (NHTSA FARS, June 2026).
- The state share ranged from 1.5% in Hawaii (2 trucks) to 18.1% in North Dakota (23 trucks) (NHTSA FARS, June 2026).
- 20 states were at 10% or higher (NHTSA FARS, June 2026).
- Texas had 699 large trucks in fatal crashes, 11.6% of its 6,018 vehicles in fatal crashes, and 13.4% of the U.S. large-truck total (NHTSA FARS, June 2026).
- Arizona: 154 large trucks, 8.6% of 1,782 vehicles (NHTSA FARS, June 2026).
- California: 386 large trucks, 7.2% of 5,390 vehicles (NHTSA FARS, June 2026).
- Colorado: 98 large trucks, 9.6% of 1,026 vehicles (NHTSA FARS, June 2026).
- Kansas: 61 large trucks, 12.4% of 492 vehicles (NHTSA FARS, June 2026).
How many people were killed in those states?
- Arizona: 140 deaths in large-truck crashes (29 truck occupants, 96 other-vehicle occupants, 15 nonoccupants) (NHTSA FARS, June 2026).
- California: 391 deaths (38 truck occupants, 285 other-vehicle occupants, 68 nonoccupants) (NHTSA FARS, June 2026).
- Colorado: 105 deaths (19 truck occupants, 76 other-vehicle occupants, 10 nonoccupants) (NHTSA FARS, June 2026).
- Florida: 353 deaths, including 42 truck occupants, the second-highest truck-occupant count after Texas (NHTSA FARS, June 2026).
- Texas: 136 truck occupants killed, 511 other-vehicle occupants, 73 nonoccupants (NHTSA FARS, June 2026).
- 11 states had more than 100 other-vehicle occupants killed in large-truck crashes (NHTSA FARS, June 2026).
What does the workplace file say that FARS does not?
BLS CFOI is a work-death census. A truck driver killed off the clock in a personal vehicle is not this table. A truck driver killed on the job is. Do not add CFOI to FARS.
- 5,070 fatal work injuries in the United States in 2024, down 4.0% from 5,283, a rate of 3.3 per 100,000 FTE workers (BLS, February 2026).
- A worker died every 104 minutes in 2024 (BLS, February 2026).
- Transportation and material moving occupations had 1,391 fatal work injuries, a rate of 12.5 per 100,000 FTE (BLS, February 2026).
- Transportation incidents were 38.2% of occupational fatalities (1,937) (BLS, February 2026).
- Roadway incidents involving motorized land vehicles fell 8.5% to 1,146; pedestrian incidents involving motorized land vehicles rose 19.0% to 369 (BLS, February 2026).
- Motor vehicle operators had 1,018 fatal work injuries in 2024 (BLS, February 2026).
- Construction and extraction occupations had 1,032 fatal work injuries (BLS, February 2026).
- Private industry recorded 2.5 million injury and illness cases in 2024, an incidence rate of 2.3 per 100 FTE workers (BLS SOII, January 2026).
Methodology and Sources
Stats were selected from origin reports that produce the data: NHTSA FARS and CRSS, FMCSA LTBCF and MCMIS, FHWA Highway Statistics VM-1, BLS CFOI and SOII, and IIHS Fatality Facts tables that publish their own FARS cuts. A roundup that quotes those numbers is not a source. NHTSA 2024 and FMCSA 2022 are different years; they stay attributed. CRSS injury counts are estimates. FARS death counts are a census. BLS work deaths are a third book. This page is refreshed monthly. It does not publish settlements, verdicts, or case-value averages.
Glossary
- FARS: Fatality Analysis Reporting System, NHTSA census of fatal crashes on public trafficways
- CRSS: Crash Report Sampling System, national estimates of police-reported injury and PDO crashes
- ARF: Annual Report File, FARS year still subject to Final File revision
- GVWR: gross vehicle weight rating
- VMT: vehicle miles traveled
- MCMIS: Motor Carrier Management Information System (FMCSA)
- LTBCF: Large Truck and Bus Crash Facts (FMCSA)
- CFOI: Census of Fatal Occupational Injuries (BLS)
- SOII: Survey of Occupational Injuries and Illnesses (BLS)
- PDO: property-damage-only
- BAC: blood alcohol concentration
- IIHS: Insurance Institute for Highway Safety
Sources
- NHTSA NCSA, Large trucks: 2024 data (DOT HS 813 816)
- NHTSA NCSA, Overview of motor vehicle traffic crashes in 2024 (DOT HS 813 791)
- FMCSA, Large Truck and Bus Crash Facts 2022
- FMCSA, Large Truck and Bus Crash Facts index
- FMCSA, 2024 Pocket Guide to Large Truck and Bus Statistics
- FHWA Highway Statistics 2024, Table VM-1
- BLS, Census of Fatal Occupational Injuries Summary, 2024
- BLS, CFOI Table 3, selected occupations 2020-24
- BLS, Employer-Reported Workplace Injuries and Illnesses, 2024
- IIHS Fatality Facts 2024, Large trucks
- Colorado car accident statistics (parent-firm census)
Hurt in a truck crash? Get a free review.
This page is a census, not a valuation. A licensed attorney can read the crash report and the coverage. No fee unless we recover.
Talk to a lawyer — free.
Calls get the fastest answer. Prefer to start on your own? Take the 2-minute claim review.
✓ 100% Free ✓ No fee unless we win ✓ Confidential